
The GFS model is "run" 4 times daily to produce a forecast. The precipitation
output from each of these forecasts is available on this site (currently out to a maximum
of 180 hours, to be extended to 384 hours in the future) at the following times :
00z run - 2:30-3pm AEST
06z run - 8:30-9pm AEST
12z run - 2:30-3am AEST
18z run - 8:30-9am AEST
06z run - 8:30-9pm AEST
12z run - 2:30-3am AEST
18z run - 8:30-9am AEST
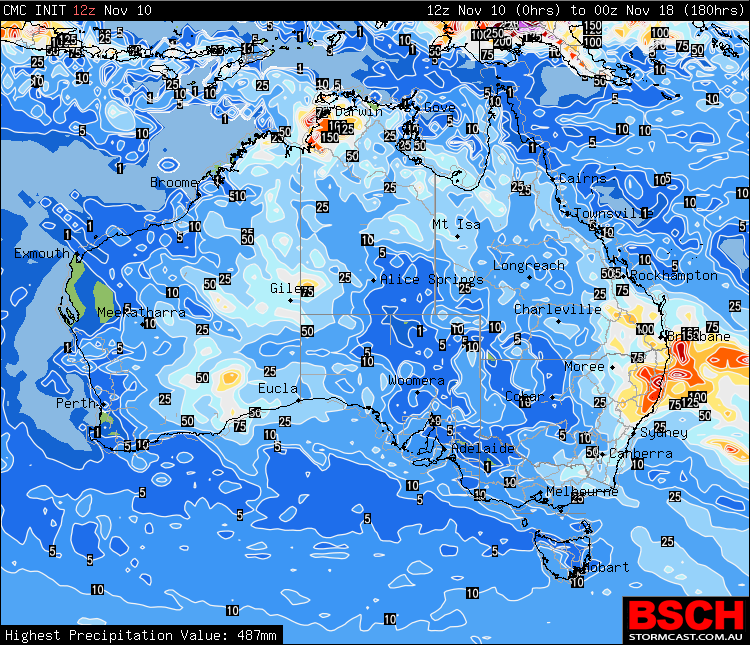
These images display the direct output from the GFS model and should be used in conjunction with
other meteoroligical guidance to obtain the most accurate indiction as to how much precipitation
is likely to fall in any one area.
Chart times displayed in AEST
| 0 | .2 | 1 | 5 | 10 | 25 | 50 | 75 | 100 | 125 | 150 | 175 | 200 | 225 | 250 | 275 | 300 | 325 | 350 | 375 |